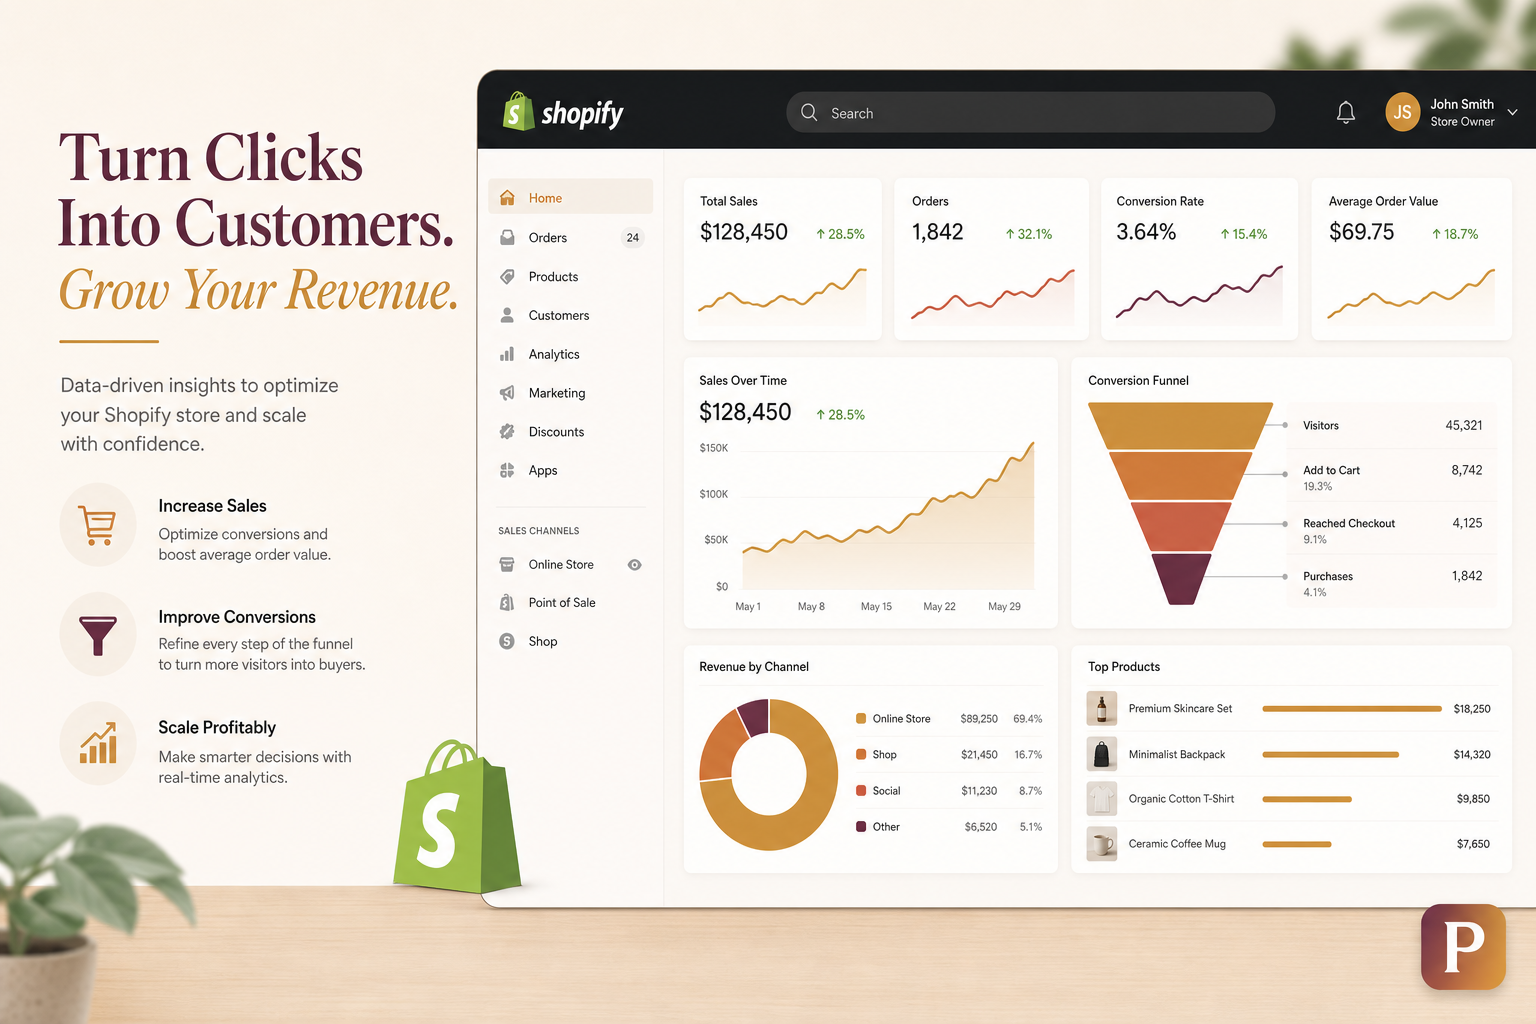
Shopify CRO Optimization: The D2C Conversion Playbook for US & UK Brands (2026)
Why CRO Matters More Than Traffic in 2026
The economics have shifted. In 2026, acquiring a new customer in the US costs $45-85 depending on category. In the UK, £30-65. Meanwhile, a 0.5% conversion rate improvement on 100,000 monthly visitors adds 500 orders — at a $60 AOV, that's $30,000 in additional monthly revenue with zero incremental ad spend.
Yet most D2C brands still pour 80% of their budget into acquisition and 5% into conversion. The brands that are winning — the ones hitting 3-4% conversion rates — have flipped that ratio. They invest in the experience first, then scale traffic into a store that actually converts.
Phase 1: The CRO Audit (Week 1)
Before you test anything, understand what's broken. A proper audit covers four layers:
1. Quantitative Analysis
- Google Analytics 4 + Shopify Analytics: Map the full funnel — sessions → product views → add-to-cart → checkout → purchase. Find the steepest drop-off.
- Hotjar or Microsoft Clarity: Heatmaps and scroll depth on your top 5 pages. Are users scrolling past your value proposition? Missing your CTA?
- Session recordings: Watch 30-50 sessions. You'll spot friction in minutes — rage clicks, dead clicks, abandoned carts at specific fields.
- Core Web Vitals: LCP under 2.5s, CLS under 0.1, INP under 200ms. Google ranks faster stores higher, and users convert at 2-3x the rate on fast sites.
2. Qualitative Analysis
- Post-purchase surveys: Add a 1-question survey post-checkout: "What almost stopped you from buying?" The answers are your CRO roadmap.
- Customer support logs: What are the top 10 questions in Gorgias/Zendesk? Each is a friction point on your site.
- Exit-intent feedback: A simple "Why are you leaving today?" popup captures intent data you can't get anywhere else.
3. Competitive Benchmarking
Pull 5 competitors in the US and UK. Compare:
| Element | What to Check |
|---|---|
| Page load speed | Lighthouse score — competitor vs. you |
| PDP structure | Image count, reviews placement, sticky add-to-cart |
| Checkout steps | Number of fields, express checkout options |
| Trust signals | Reviews, badges, guarantees, return policy visibility |
| Mobile UX | Thumb-zone CTAs, sticky bars, collapsible sections |
4. Revenue Impact Prioritization
Use the ICE framework — Impact, Confidence, Ease — to rank every opportunity. A sticky add-to-cart bar might score 8/5/9 = 7.3. A full PDP redesign scores 9/6/2 = 5.7. Start with the highest ICE score, not the biggest idea.
Phase 2: High-Impact Optimizations (Weeks 2-4)
Based on 200+ Shopify audits across US and UK brands, these are the changes that consistently move conversion rate:
Product Detail Pages (PDPs)
- Sticky add-to-cart: Keep the buy button visible on scroll. Typical lift: 8-15% on mobile.
- Variant images: When a user selects a color/size, swap the main image. Reduces returns and increases confidence. Lift: 5-10%.
- Urgency that's real: "Only 3 left in size M" (from actual inventory) — not fake countdown timers. US/UK consumers are savvy; fake urgency damages trust.
- Review prominence: Star rating visible above the fold. Photo reviews in the gallery. Lift: 7-12%.
- Shipping transparency: "Free shipping over $50" or "Ships in 1-2 business days" directly under the price. Hidden shipping costs are the #1 checkout killer.
Cart & Checkout
- Slide-out cart drawer: Keeps users on the PDP instead of redirecting to a cart page. Lift: 5-8%.
- Express checkout: Shop Pay, Apple Pay, Google Pay, PayPal. These convert at 2-3x the rate of standard checkout. In the US, Shop Pay alone can account for 30%+ of checkouts.
- Trust badges in checkout: SSL, payment icons, return policy link. Simple but effective — especially for first-time customers.
- Progress indicator: "Step 1 of 3" reduces checkout anxiety and abandonment.
- Address autocomplete: Google Places or Shopify's native autocomplete. Reduces checkout time by 30 seconds and eliminates address errors.
Homepage & Navigation
- Value proposition above the fold: One sentence. "Premium skincare, clinically proven, shipped free." Not a vague mission statement.
- Social proof: "Trusted by 50,000+ customers" or press logos (Vogue, GQ, Forbes). Instantly signals legitimacy.
- Collection page filters: Size, color, price, sort-by. Users who filter are 3x more likely to convert.
- Search functionality: If you have 50+ products, predictive search with product images. Users who search convert at 4-6x the rate of browsers.
Phase 3: Testing Framework (Ongoing)
CRO without testing is guesswork. Here's how to build a repeatable testing engine:
Choosing What to Test
- Test pages with the most traffic first. 10,000+ monthly sessions = statistical significance in 2-3 weeks.
- One variable at a time. If you change the CTA text, color, and position simultaneously, you won't know what worked.
- Hypothesis-driven: "Changing the add-to-cart button from green to berry (#7e4152) will increase clicks by 10% because it contrasts better with the neutral background."
Testing Tools for Shopify
- Shopify native A/B testing (Shopify Editions): Built into Shopify Plus. Test product templates, checkout extensions.
- Google Optimize (sunset) → VWO or Optimizely: For theme-level A/B tests. VWO has a Shopify app integration.
- Intellimize or Dynamic Yield: AI-driven personalization for larger brands ($5M+ revenue).
Statistical Significance
Don't call a test before it's valid. You need:
- At least 1,000 conversions per variant (not sessions — conversions)
- Minimum 2-week test duration to account for day-of-week variation
- 95% confidence interval before declaring a winner
- No peeking — checking daily and stopping early inflates false positives by 30%+
Phase 4: Advanced CRO (Month 2+)
Once the fundamentals are optimized, move to advanced tactics:
Personalization
- Geo-targeting: Show free shipping banners for US states where you offer it. Different promotions for UK vs. US visitors.
- Return visitor experience: "Welcome back" with recently viewed products. Show alternative products to users who abandoned a specific PDP.
- VIP customer experience: Free shipping, early access, or exclusive products for customers with 3+ orders. LTV optimization is CRO's cousin.
Email & SMS Capture Optimization
- Exit-intent popup: 10-15% off first order. Captures 3-8% of exiting visitors.
- Embedded forms: In the footer, blog sidebar, and PDP. Non-intrusive but always present.
- SMS capture: Higher deliverability and open rates than email. "Text me 10% off" converts well for Gen Z audiences.
Post-Purchase Optimization
- Order confirmation page: Upsell complementary products or offer a discount on the next order.
- Post-purchase survey: "How did you hear about us?" Attribution data that Google Analytics can't give you.
- Review requests: Automated email 14 days post-delivery with a photo review incentive. Builds social proof for future CRO.
US vs. UK: Market-Specific Nuances
| Factor | US Market | UK Market |
|---|---|---|
| Express checkout | Shop Pay dominant (30%+ of checkouts) | Apple Pay + PayPal dominant |
| Shipping expectation | 2-3 day free shipping over $50 | Next-day delivery expected; £50 threshold |
| Payment methods | Credit cards, Shop Pay, Affirm (BNPL) | Credit cards, Klarna, Clearpay (BNPL) |
| Trust signals | BBB rating, money-back guarantee | Trustpilot reviews, free returns |
| Mobile traffic | 65-70% of sessions | 70-75% of sessions |
| Average conversion rate | 1.5-2.5% (D2C benchmark) | 1.8-2.8% (D2C benchmark) |
Measuring Success: The CRO Dashboard
Track these metrics weekly. If any drop, investigate immediately:
- Overall conversion rate (sessions → purchases)
- Add-to-cart rate (sessions → add-to-cart)
- Cart-to-checkout rate (add-to-cart → checkout started)
- Checkout completion rate (checkout started → purchase)
- Mobile vs. desktop conversion rate (gap should be under 30%)
- Average order value (AOV)
- Revenue per visitor (RPV) — the ultimate CRO metric
The Bottom Line
CRO isn't a one-time project. It's a continuous discipline. The D2C brands hitting 3-4% conversion rates aren't smarter than you — they're just more systematic. They audit, hypothesize, test, and scale. Every month, they squeeze a little more revenue from the same traffic.
In 2026, with ad costs at record highs, the brands that win won't be the ones with the biggest ad budgets. They'll be the ones whose stores convert like crazy. Start with the audit. Fix the obvious leaks. Then build the testing engine. Your conversion rate is the highest-ROI lever in your business — and it's entirely within your control.
Ready to Double Your Conversion Rate?
I help US and UK D2C brands audit, optimize, and systematically improve their Shopify conversion rates. From full CRO audits to A/B testing programs — let's find your biggest revenue leaks and fix them.
Last updated: July 2026 | Author: Pravesh | pravesh.online