Shopify Returns & Exchanges Optimization: The D2C Playbook for US & UK Brands (2026)
The State of Returns in 2026: Why This Matters Now
Returns have quietly become D2C's biggest margin killer. In the US, returns cost brands an estimated $816 billion in 2025 — and projections for 2026 show that number climbing past $890 billion. In the UK, the figure sits at roughly £60 billion annually. For a mid-sized D2C brand doing $5M in annual revenue with a 25% return rate, that's $1.25M in potential revenue walking back through the door — and the real cost, after processing, shipping, and markdowns on returned inventory, often exceeds $200,000 per year.
The brands winning in 2026 aren't the ones with zero returns — that's impossible. They're the ones who've built returns into a strategic advantage: lower return rates through better product data, higher exchange conversions through smart portal design, and deeper customer loyalty through frictionless experiences. They treat returns not as a cost of doing business but as a retention channel with its own conversion funnel, analytics, and optimization cycle.
And the clock is ticking. Both US and UK consumers now rank "easy returns" as the #2 factor in purchase decisions — behind only price. If your returns experience feels like 2018, your customers are quietly churning to competitors who've modernized. Let's fix that.
1. Exchange-First Returns: Keep the Revenue, Keep the Customer
The single highest-ROI change you can make to your returns workflow is switching from a refund-first to an exchange-first model. Here's why the math is undeniable:
- Refund: You lose the sale, pay $15 in reverse logistics, and lose the customer (only 15-20% of refunded customers ever buy again).
- Exchange: You keep 70-85% of the revenue (even after size/color swaps), pay minimal logistics, and retain a customer who's now more confident in your product. Exchange customers repurchase at a 30-40% rate within 90 days.
Exchange-first doesn't mean removing the refund option — that would violate consumer protection laws in both the US and UK. It means designing the returns flow so that exchanging is the path of least resistance, while refunding requires slightly more intent.
How to Structure an Exchange-First Portal
- Immediate size/color swap: The first option after "Start a Return" should be "Exchange for a different size or color" — one click, instant confirmation, new item ships immediately.
- Store credit with a bonus: "Get $55 in store credit instead of a $50 refund." The 10% bonus costs you $5 but retains the full $55 for future margin. This alone can convert 25-40% of refund requests into retained revenue.
- Instant exchange shipping: Ship the replacement the moment the return label is scanned by the carrier — don't wait for the warehouse to receive the return. Loop and Returnly both support this. Customer wait time drops from 10-14 days to 2-3 days.
- Cross-sell at exchange: "You're exchanging the Medium for a Large. Customers who bought this also loved the Relaxed Fit version — try it instead?" Contextual, helpful, not pushy.
Brands using exchange-first flows report retaining 52-68% of would-be refund revenue. For a $5M brand with a 25% return rate, that's $650,000-850,000 in retained annual revenue — before factoring in the higher LTV of exchange customers.
2. Return Portal Setup: Loop, Returnly, Happy Returns & Beyond
A native Shopify returns page — a static page with an email address — is costing you money every day. Modern return portals are conversion-optimized experiences that guide customers through a branded, self-service flow. Here's how the major platforms compare for US and UK D2C brands:
| Platform | Best For | Key Feature | Pricing | US / UK |
|---|---|---|---|---|
| Loop Returns | Mid-market & enterprise ($5M+) | Exchange-first workflows, instant exchanges, advanced analytics, branded portal | Starts ~$250/mo + per-return fees | Strong US coverage; expanding UK |
| Returnly | Mid-market ($2-10M) | Instant credit for exchanges, green returns (no printer needed), Shopify-native | Starts ~$149/mo | US-focused; limited UK carrier integrations |
| Happy Returns | Omnichannel D2C | In-person drop-off at 10,000+ locations (US), no-box-no-label returns | Custom pricing; per-return fees | Strong US; UK via PayPal partnership |
| ZigZag Global | UK & cross-border | UK carrier network (Royal Mail, Evri, DPD), international returns consolidation | Starts ~£99/mo | UK-native; expanding US |
| AfterShip Returns | Small-to-mid ($500K-5M) | Free tier available, 20+ carrier integrations, branded portal, multi-language | Free-$99/mo | Both US and UK coverage |
| Re:amaze Returns | Support-integrated | Returns embedded in helpdesk, auto-approval rules, Shopify-integrated | Starts ~$29/mo | Both markets |
What to Look For When Choosing a Portal
- Exchange-first routing: Does the portal default to exchange options or refund? You want the former.
- Carrier integrations: For the US — USPS, UPS, FedEx, and Happy Returns drop-off. For the UK — Royal Mail, Evri, DPD, Collect+, and InPost lockers.
- QR code returns: Eliminates printer dependency. 40% of US returns and 55% of UK returns are now initiated via QR code. If your portal doesn't support it, you're adding friction.
- Branded experience: The portal should look like your store, not a third-party widget. White-labeling drives trust and reduces "where's my refund?" support tickets.
- Analytics & reporting: Return reason data, exchange-vs-refund split, return rate by product/SKU, and carrier performance — all in one dashboard.
3. QR Code Returns: The Paperless Revolution
QR code returns have gone from nice-to-have to table stakes in 2026. Here's why they matter — and how to implement them across US and UK carrier networks:
Why QR Codes Convert
- No printer needed: 23% of US households and 18% of UK households don't own a printer. For mobile-first Gen Z shoppers, that number jumps to 40%+. If your returns process requires printing a label, you lose those customers to competitors who don't.
- Faster drop-off: Customer walks into a carrier location, shows the QR code on their phone, hands over the unboxed item. 30 seconds. No tape, no label, no friction.
- Higher completion rates: QR code returns have a 92% completion rate vs. 74% for print-at-home labels. Why? Because the intent-to-action gap is measured in minutes, not days.
US QR Code Drop-Off Networks
- Happy Returns Bars: 10,000+ locations inside FedEx Office, Ulta Beauty, and other retail partners. No box, no label. Items are consolidated and shipped back in bulk — reducing per-unit return shipping costs by 30-40%.
- UPS QR Returns: Generate a QR code; customer shows it at any UPS Store or Access Point. UPS prints the label in-store.
- FedEx QR Returns: Similar workflow — QR code at any FedEx Office or Walgreens FedEx drop-off.
- USPS Label Broker: Less seamless than QR-native solutions but available at 31,000+ post offices. Customer gives a code; USPS prints the label.
UK QR Code Drop-Off Networks
- Royal Mail QR Returns: QR code generated at portal; scanned at any Post Office or Royal Mail Customer Service Point. The Post Office prints the label. Covers 11,500+ locations.
- Evri ParcelShops: 15,000+ locations, many open late and on weekends. QR code scanned; label printed in-store. Dominant for fashion and lifestyle returns.
- InPost Lockers: 6,000+ locker locations across the UK. Customer scans QR code at the locker screen, deposits the item, and walks away. No human interaction, 24/7 access. Growing at 40%+ YoY.
- DPD Pickup Shops: 6,000+ locations. QR code returns supported at all shops.
- Collect+: 7,000+ convenience store locations. QR code scanned; label printed. Strong coverage in residential areas.
The implementation is straightforward: most modern return portals (Loop, AfterShip, ZigZag) have QR code generation built in. You select which carrier networks to offer, and the portal generates a unique QR code per return. The key operational decision is whether to offer all carriers or optimize for cost — Happy Returns consolidation, for example, can reduce US return shipping by 30-40% compared to individual UPS/USPS labels.
4. Return Policy Optimization: Make It a Selling Point
Your return policy isn't just fine print — it's a conversion tool. A well-crafted policy can increase purchase confidence by 18-25%, while a confusing one is the #3 reason for cart abandonment. Here's how to optimize yours for US and UK D2C:
The Policy Sweet Spot
- 30-day window is the baseline: Both US and UK consumers expect at least 30 days. Going below this signals distrust. Going above 60 days (unless you're a luxury brand) increases return rate without proportional conversion lift.
- Free returns: yes or no? In the UK, free returns are table stakes — 72% of UK shoppers won't buy without them, and the Consumer Contracts Regulations already mandate free returns for online purchases within 14 days (though return shipping can be charged if disclosed). In the US, only 55% of D2C brands offer free returns. If you charge, make it clear upfront — "Returns are $5.99, deducted from your refund" — and consider free exchanges as a compromise.
- Holiday extensions: Extend to 60-90 days for purchases made November-December. This is standard practice in both markets and protects you from post-holiday chargeback spikes.
- Final sale clarity: Clearly mark items that can't be returned — underwear, personalized products, digital goods. Ambiguity here generates the most support tickets and chargebacks.
Where to Display Your Policy
- PDP (product detail page): A discreet but visible link or expandable section near the add-to-cart button. "Free 30-day returns" or "Easy exchanges" — short, confident, reassuring.
- Cart drawer: "Free returns within 30 days" as a trust badge near the checkout button.
- Checkout footer: A one-liner summary with a link to the full policy.
- Order confirmation email: "Changed your mind? Returns are easy. Start here →" with a link to your portal. Gets ahead of buyer's remorse.
- Dedicated returns page: SEO-optimized, mobile-friendly, with clear steps and a portal link. This page alone can reduce "how do I return?" support tickets by 40%.
5. Reducing Return Rates: Attack the Root Causes
The best return is the one that never happens. While you can't eliminate returns entirely, you can systematically reduce them by addressing the root causes. Here are the highest-impact levers for D2C brands:
1. Better Product Data
- Size guides with actual measurements: Not "Model wears size M." Give garment measurements for every size — chest, length, sleeve. Brands that add detailed measurements see a 20-25% reduction in size-related returns.
- Fit prediction tools: "What's your height and weight? Based on 12,000 customers similar to you, we recommend size L." Tools like Fit Finder, True Fit, or Size Sense use purchase and return data to make smart recommendations. Typical impact: 12-18% reduction in fit returns.
- 360-degree product views and video: Static photos hide fit, drape, and scale. Video and 3D spins reduce "didn't look like the picture" returns by 20-30%.
- Material transparency: "95% cotton, 5% elastane. Feels structured with slight stretch. Not see-through on light colors." Descriptive, honest, expectation-setting copy. Returns driven by "fabric didn't match description" drop by 30%+.
2. Customer-Reported Photos in Reviews
Photo reviews from real customers — especially showing fit on different body types — are the single most underrated return-reduction tool. When a shopper sees someone with a similar build wearing the product, their confidence in the purchase skyrockets. Encourage photo reviews with a loyalty points bonus or small discount on the next order. Brands with 50+ photo reviews per SKU see return rate reductions of 15-22%.
3. Pre-Purchase Guidance
- "Complete the look" with sizing notes: "The Relaxed Tee fits oversized — size down for a regular fit." Contextual, product-specific, genuinely helpful.
- Post-purchase survey at returns: "Why are you returning this?" with specific, categorized reasons. Map the data back to products and fix the root cause — update the size guide, add better photos, clarify the description. Every return reason is a product page improvement waiting to happen.
6. Self-Service Returns: Automate Away the Support Load
Every return that requires human intervention — an email to support, a DM on Instagram, a phone call — costs you $8-15 in support labor and erodes customer goodwill while they wait. Self-service returns flip that dynamic: instant, 24/7, zero support cost, and the customer feels empowered rather than frustrated.
Building a Frictionless Self-Service Flow
- Customer visits your returns portal (linked from the footer, order confirmation email, and shipping notification).
- Enters order number and email or ZIP code — ideally pre-filled when the link comes from an email.
- Selects items to return with reason codes: "Too small," "Too large," "Changed mind," "Defective," "Not as expected." Keep it under 8 options to reduce cognitive load.
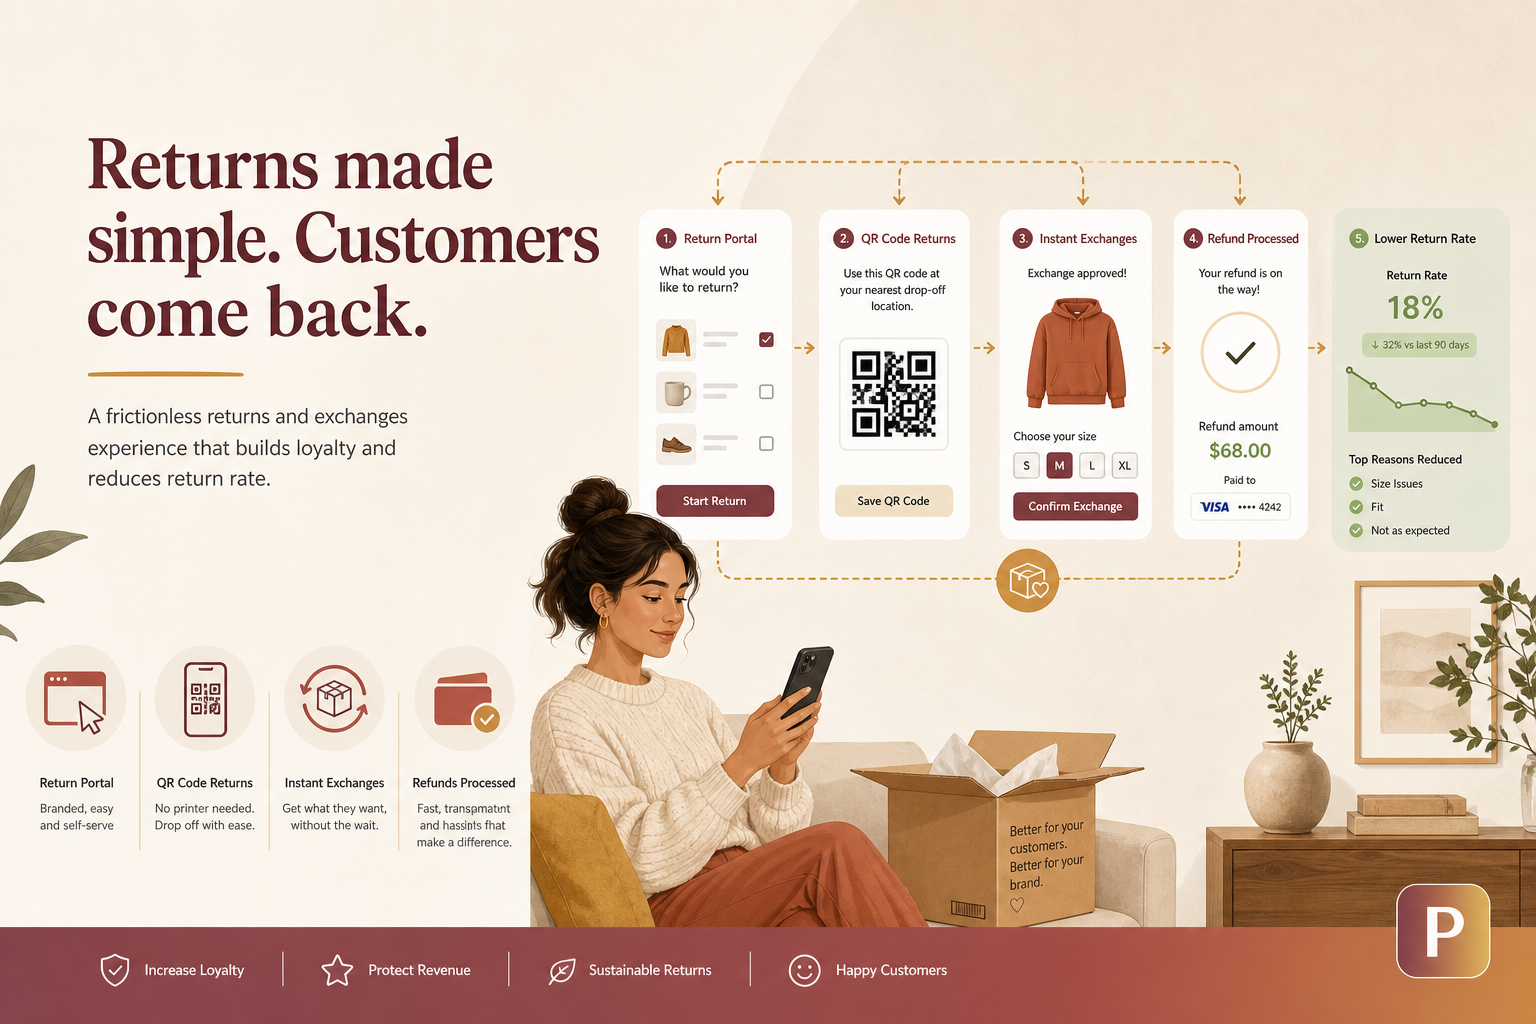
- Portal routes intelligently: "Too small? We have a Large available. Exchange now and we'll ship it today." For "Defective," auto-generate a prepaid return label and trigger a replacement shipment. For "Changed mind," offer store credit with a 10% bonus.
- Customer selects return method — QR code drop-off, print-at-home label, or in-person drop-off (Happy Returns, InPost locker).
- Instant confirmation — email with QR code or label, tracking link, and estimated refund/exchange timeline.
Brands that implement full self-service returns see a 60-80% reduction in return-related support tickets, a 35% increase in exchange-vs-refund ratio, and a measurable bump in NPS scores. The upfront setup takes 2-4 weeks with a good portal provider; the payback period is typically under 3 months.
7. Return Analytics: The Data Goldmine Hiding in Plain Sight
Most brands look at their return rate as a single number — 22%, up from 19% last quarter, time to panic. But the aggregate number hides the signal. Return analytics, when done right, tell you exactly what to fix, in what order, with what expected impact.
The Return Analytics Dashboard
| Metric | What It Tells You | Benchmark |
|---|---|---|
| Return rate by product SKU | Which products have structural issues — bad sizing, misleading images, quality problems | Identify SKUs 2x above category average |
| Return rate by size/variant | Specific size runs small/large, specific colors look different online | Flag variants with >10% deviation from product average |
| Return reason distribution | Too small (40%), Changed mind (25%), Defective (5%) — direct roadmap for product page fixes | Fit issues should be under 35% of all returns |
| Exchange vs. refund split | How well your portal converts refunds into exchanges | Target 35-50% exchange rate |
| Return-to-repeat-purchase rate | What % of returning customers buy again within 90 days | Target 30%+ for exchangers, 15%+ for refunders |
| Return window utilization | Are customers returning immediately (impulse correction) or on day 29 (wardrobing)? | Day 1-7 returns: 55%. Day 25-30: under 10% |
| Cost per return by method | QR drop-off vs. mail-in vs. in-person — which costs least? | QR consolidated returns: 30-40% cheaper |
| Return rate by acquisition channel | Social media customers return 30% more on average — adjust ad targeting and landing pages | Organic returns typically 15-20% lower than paid social |
Turning Analytics Into Action
- SKU-level returns over 40%: Pull the product from sale, investigate sizing/quality/imagery, fix or discontinue. Every day it stays live costs you money and damages brand reputation.
- "Too large" on Size M at 3x the rate of other sizes: The Medium runs large. Update the size guide, add a fit note on the PDP, and inform the buying team for the next production run.
- Exchange rate under 20%: Your portal isn't routing effectively. Audit the flow — is the exchange option visible? Is instant exchange shipping enabled? Is the store-credit bonus compelling enough?
- Spike in returns from a specific ad campaign: The ad creative is attracting the wrong customers or setting wrong expectations. Adjust the creative or landing page to pre-qualify better.
8. Environmental Impact Messaging: Turn Returns Into a Sustainability Story
Returns have a hidden environmental cost — and your customers increasingly care about it. In 2026, 64% of US and 71% of UK consumers say sustainability influences their purchase decisions. The return process is one of the most carbon-intensive parts of ecommerce: reverse logistics doubles the transportation footprint of a sale, and 25% of returned items end up in landfills because restocking isn't economically viable.
Smart brands are reframing returns from "free and easy" to "thoughtful and responsible" — without making customers feel guilty or restricted.
Messaging Strategies That Work
- "Exchange, don't return": "Exchanging instead of returning saves 2.3 kg of CO₂ per order. Plus you get the right size faster." Frames the exchange as both the smart choice and the responsible choice.
- "We'll plant a tree when you exchange": A small cost ($1-3 per tree) that generates goodwill and increases exchange rate by 8-12%. One tree is planted for every completed exchange — visible on a public impact dashboard.
- "Keep it, gift it": For low-cost items where return shipping exceeds product value: "Keep this item and gift it to a friend. We'll refund you anyway." This eliminates reverse logistics entirely and turns a return into a brand advocacy moment. UK brands using this approach report a 15% increase in referral traffic from gift recipients.
- Consolidated returns: "We batch-process returns to minimize shipping miles. Your return will be processed within 7 days — slightly slower, but 40% fewer carbon emissions." Transparency builds trust.
- Return packaging: "If you're returning, reuse the original packaging. No need for new materials." Simple, practical, appreciated.
The key principle: make sustainable choices the easy, default choice — not a sacrifice. Customers will choose the greener option every time if you remove friction and frame it around shared values, not deprivation.
9. US vs. UK: Market-Specific Return Expectations
Returns culture varies meaningfully between the two markets. What's standard in New York will frustrate customers in London — and vice versa. Here's how to calibrate your approach:
| Factor | US Market | UK Market |
|---|---|---|
| Return window expectation | 30 days is standard; 60-90 days for premium brands | 14 days legal minimum; 28-30 days is competitive standard |
| Free returns | 55% of D2C brands offer; a differentiator if you do | 72% of consumers expect free returns; penalized heavily if you don't |
| Return method preference | Mail-in (UPS/USPS) dominates; Happy Returns drop-off growing fast | Drop-off dominant — Post Office, Evri, InPost lockers, Collect+ |
| QR code adoption | 40% of returns; growing 15% YoY | 55% of returns; already mainstream |
| Exchange tolerance | Moderate — US consumers are open to exchanges if the process is fast | High — UK consumers are more willing to exchange than refund vs. US peers |
| BNPL returns complexity | Klarna and Affirm returns require careful handling — refunds must sync with installment plans | Klarna and Clearpay dominant; same sync requirement |
| Legal requirements | No federal return law; state-level rules (e.g., California refund policies must be conspicuously displayed) | Consumer Contracts Regulations mandate 14-day cancellation right; refund must include original shipping cost |
| Sustainability sensitivity | Growing (64% care) but secondary to convenience | Strong (71% care); environmental messaging measurably impacts brand perception |
| Carrier trust | USPS delays impact return experience in Q4 | Royal Mail strikes/backlogs periodically disrupt; Evri reliability varies by region |
Practical Implications
- If you sell in both markets: Use a portal that supports geo-routing — UK customers see Royal Mail and Evri QR options; US customers see UPS and Happy Returns. One brand, two return experiences.
- UK brands: Free returns are non-negotiable. Budget for it or build it into pricing. The reputational damage of charging for returns in the UK market exceeds the logistics savings.
- US brands: Free exchanges with paid refunds is a viable model. "Exchanges are always free. Returns are $5.99." This steers behavior toward the higher-retention outcome while being transparent.
- BNPL handling: When a customer returns an item purchased via Klarna/Affirm/Clearpay, the portal must trigger a refund that pauses or adjusts the installment schedule — not just credit the merchant account. Most modern portals handle this automatically, but verify during setup.
10. Implementation Roadmap: 90 Days to Returns Optimization
Here's a phased plan to transform your returns operation from a margin leak into a retention engine. Adjust timelines based on your team size and current returns infrastructure.
Week 1-2: Audit & Baseline
- Pull your current return rate by product, variant, reason code, and acquisition channel.
- Map your current returns flow end-to-end — from customer initiation to refund issued. Document every step, every tool, every handoff.
- Calculate your true cost per return: shipping + processing labor + restocking + inventory depreciation + support labor.
- Benchmark against the tables above. Where are you leaking the most?
Week 3-6: Portal Setup & Policy Refresh
- Select and implement a returns portal (Loop, AfterShip, ZigZag, or equivalent).
- Configure exchange-first flows, QR code returns for your primary carriers, and branded portal styling.
- Rewrite your return policy: clear, confident, visible on PDP, cart, checkout, and email.
- Set up return reason codes that map to actionable product improvements.
- Test the full flow — from order to return to exchange to refund — on desktop and mobile. Fix every rough edge.
Week 7-10: Product Data Improvements
- For your top 20 SKUs by return volume: add detailed measurements, fit notes, and 360-degree imagery.
- Launch a photo review incentive program — loyalty points or discount for reviews with photos.
- Add fit prediction or size recommendation tool.
- Audit product descriptions for accuracy — does the copy match what the customer actually receives?
Week 11-12: Environmental Messaging & Analytics Cadence
- Add sustainability messaging to the returns portal: carbon impact of exchange vs. refund, tree-planting incentive for exchanges.
- Set up a weekly returns analytics review: SKU return rates, reason distribution, exchange rate, cost per return.
- Create a feedback loop: return reason data → product team → PDP updates → measured impact on return rate.
Ongoing: Continuous Optimization
- Monthly: review return rate trends and identify new problem SKUs.
- Quarterly: A/B test portal flows — store credit bonus amount, exchange-option prominence, QR vs. print-at-home as default.
- Seasonally: extend return windows for holiday purchases, staff up reverse logistics for January (the heaviest return month in both the US and UK).
Measuring Success: The Returns Optimization Scorecard
Track these metrics monthly. If your return rate stays flat but your exchange rate climbs and support tickets drop, you're winning:
- Overall return rate (returns ÷ orders) — target a 10-20% reduction within 6 months of optimization
- Exchange rate (exchanges ÷ total returns) — target 35-50%
- Store credit retention rate (store credit accepted ÷ offered) — target 25-40%
- Cost per return — target a 25-35% reduction through QR consolidation and self-service
- Return-to-repurchase rate (for exchangers vs. refunders)
- Return-related support tickets — target a 60%+ reduction after self-service portal launch
- Net retained revenue (exchange AOV × exchanges + store credit used) — the bottom-line metric that matters most
- Return NPS — survey returning customers: "How was your return experience?" A +20 score here predicts long-term loyalty
The Bottom Line
Returns aren't going away. In 2026, with ecommerce penetration at 28% in the US and 36% in the UK, return volumes will only grow. The brands that treat returns as a cost of doing business will watch their margins erode quarter after quarter. The brands that treat returns as a retention channel — with exchange-first portals, self-service flows, QR-code convenience, and data-driven product improvements — will turn their biggest operational headache into their strongest competitive advantage.
Start by auditing what your current returns process actually costs you — not just in shipping fees but in lost customers, support hours, and markdowns on returned inventory. Then pick the single biggest lever from this playbook: if you don't have a returns portal, get one. If you have one but it's refund-first, flip it to exchange-first. If your product pages lack measurements, add them. The ROI on each of these changes is measurable in weeks, not quarters.
Returns optimization isn't glamorous. It won't get you a standing ovation at your next team meeting. But it will quietly add 5-10% to your bottom line — and in the margin-tight world of D2C in 2026, that's the difference between thriving and just surviving.
Ready to Turn Returns Into Retained Revenue?
I help US and UK D2C brands audit their returns operations, implement exchange-first portals, and build analytics that reduce return rates by 15-25%. From portal selection to policy optimization to environmental messaging — let's stop the margin bleed and start retaining more customers through every return.
Last updated: August 2026 | Author: Pravesh | pravesh.online